A personal website about me navigating the World of AI from a Statistical Mechanics viewpoint, reviewing software engineering that I found useful and other interesting updates.
© 2022. All rights reserved.
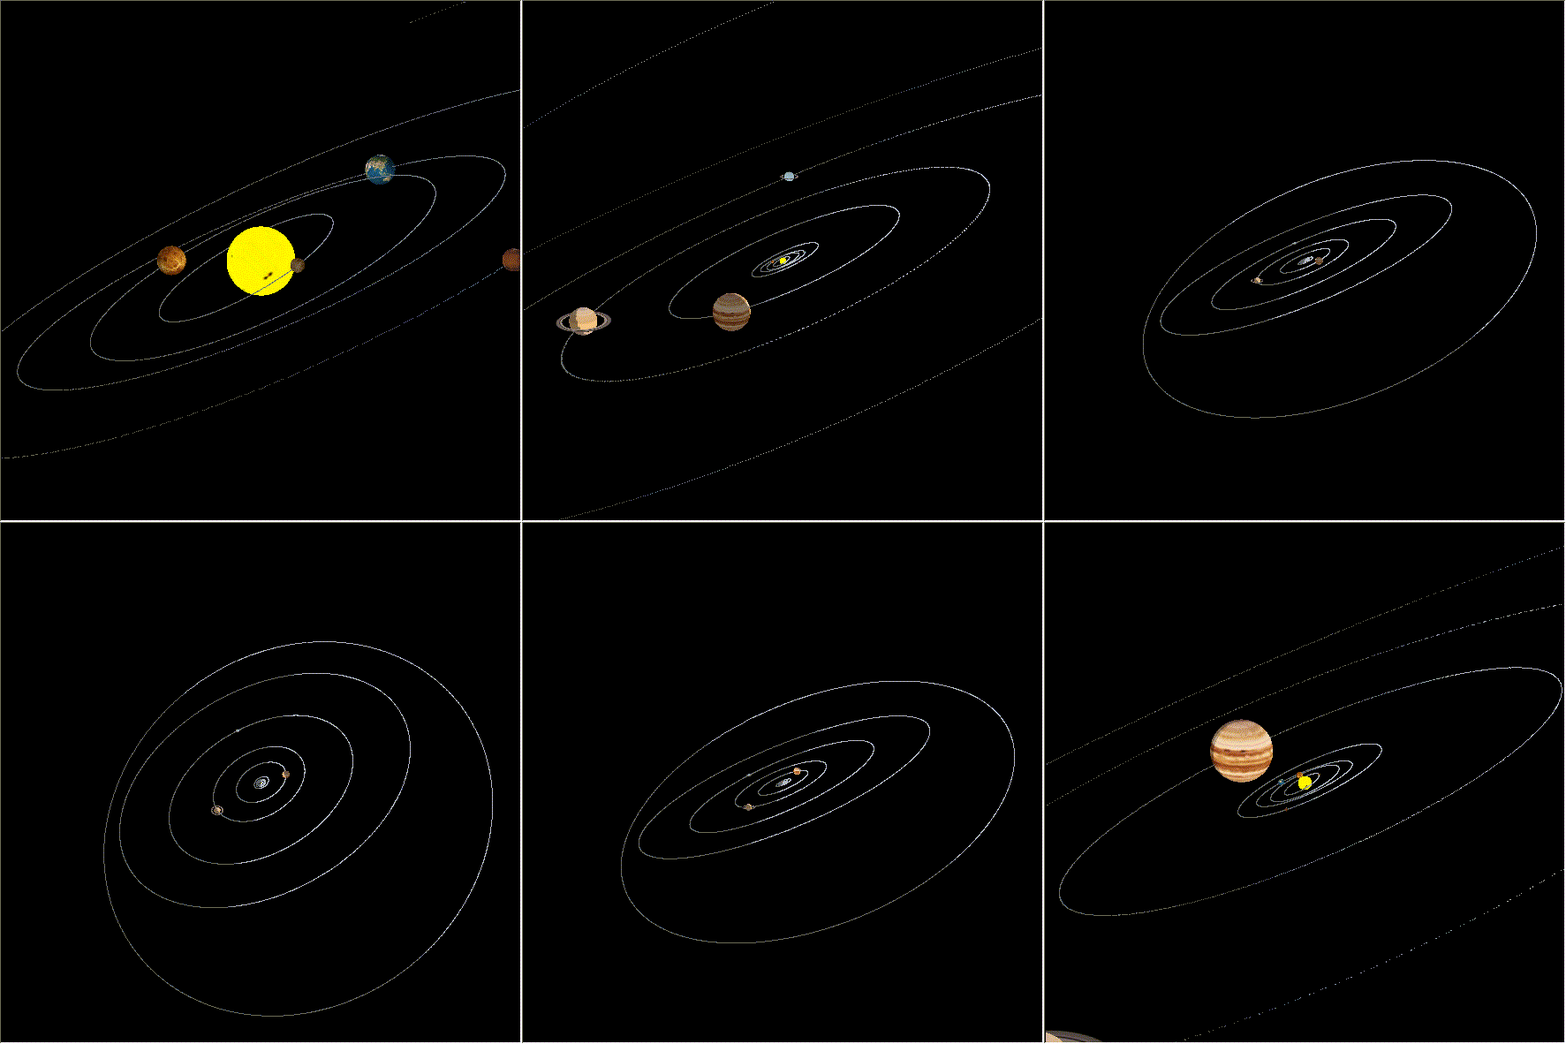
Visualization of scientific data is something I am passionate about. During my Ph.D work on long trajectory integrators I produced an OpenGL ‘Orrey’, a representation of the Solar System, with graphics supplied by NASA ‘wrapped’ onto the planets. After working on the Folding at Home OpenGL viewer I decided to pursue the idea of embedding the viewer into a webpage to illustrate our Normal Mode Langevin paper. The project, a joint effort between myself and James Sweet at Stafford University in UK, has now grown to be a general purpose viewer visualizing a number of exciting models. These range from Molecular Dynamics to Social Networking.
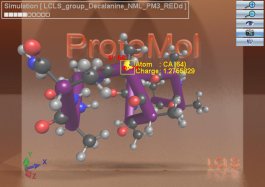
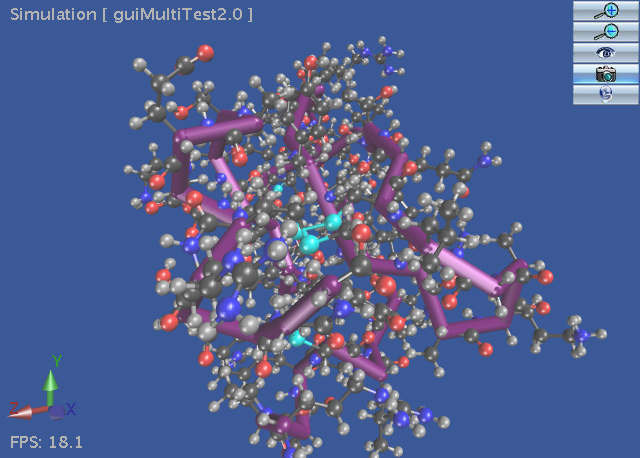
We have produced a Java Molecular Viewer using the JOGL OpenGL bindings. This allows us to observe simulations that are running remotely, and can be seen in action on the NML website. It is also used in the Grid Heating effort at the Greenhouse conservatory in South Bend, IN, to show the scientific efforts being used to heat the conservatory.
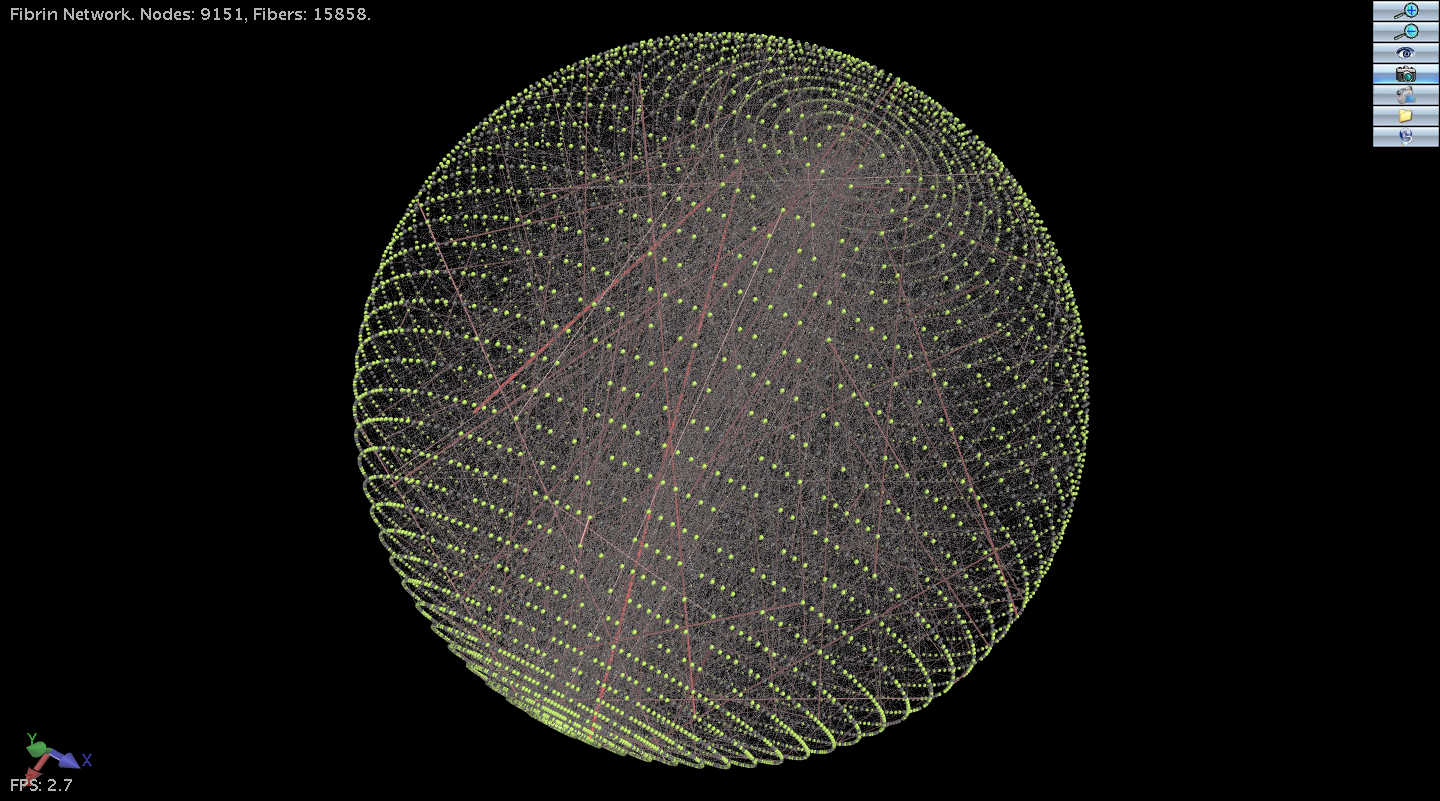
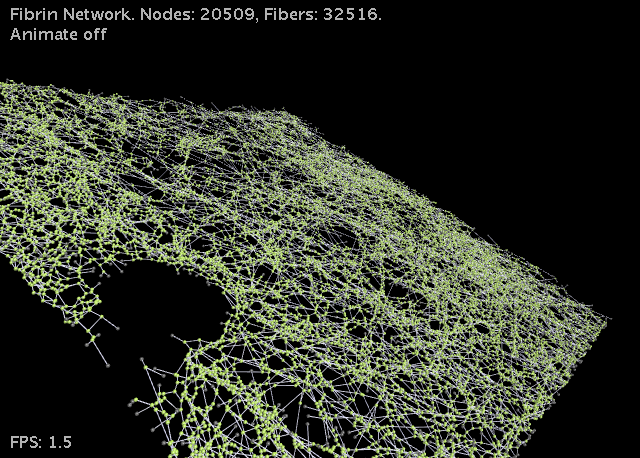
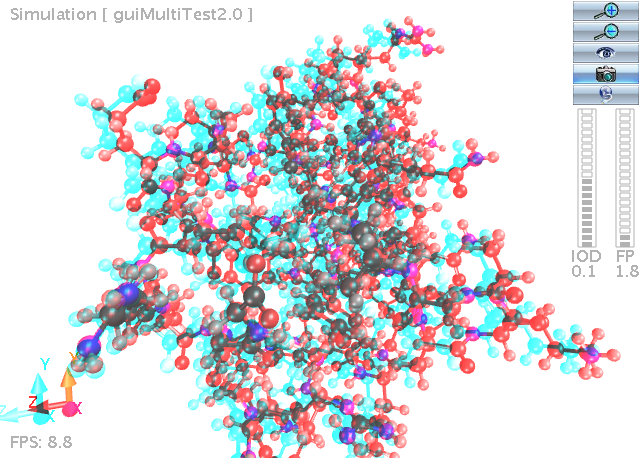
We have extended the Molecular Viewer to generate a general purpose 3D viewer which can be easily targeted at new projects. The Advanced Viewer supports 3D rendering using equipment such as the Circularly Polarized Screen at CRC or simple using Red/Magenta anaglyphs. In addition to the encapsulation of a rich set of viewer features, since the viewer is written in Java it can be embedded in a webpage as an Applet. You can see the CRC Cyberinfrastructure group viewing a Fibrin Network on the 3D equipment at this link: Cyberinfrastructure group viewing a 3D visualization.
The viewer has been targeted at visualization projects including Blood clots and Fibrin Networks with Mark Alber’s group (ND), Molecular Dynamics with Jesus Izaguirre’s group (ND), Social Networks with Zoltan Toroczkai’s group (ND) and Microtubule Simulation with Holly Goodson’s group (ND).
Faruck Morcos has documented the Fibrin and Phone network development in his networktrekker website.
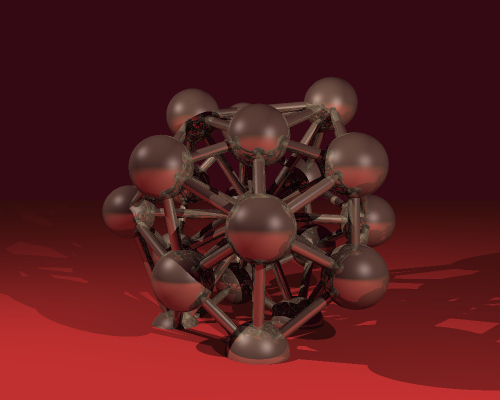
We have now added Ray Tracing for high quality output, using Tachyon.
Thanks for reading!